First-Hand:My Personal History, part 3
My Personal History, part 3
By William F. Croswell, Life Fellow. This article is a contination of Part 2B.
Background
About 1968 NASA Langley Research Center was assigned a new center director, Mr. E. M. Cortright. Mr. Cortright brought with him, among other things, a program called AAFE (Advanced Applications Flight Experiments) Program. The purpose of this program was to develop concepts that would develop into future satellite instruments. The NASA Applications office headed by Leonard Jaffe ran the program. The procurement process was the following: An announcement was prepared with a listing of possible project instruments companies and universities could propose to build. Panels of technical experts and particular ones selected reviewed these projects. Bob Parker, the NASA Langley program manager, and Leonard Jaffe reviewed the selected projects. I was invited to those meetings and assigned to review certain projects that were interesting but required a better program execution plan. Due to my years as an Air Force project officer I had developed a management skill to develop program plans. The different proposed projects were very diverse including multiple beam spacecraft communications antennas, microwave radiometer antennas and systems, scatterometers, SAR’s, laser spectrometers, IR radiometers, and many other remote sensing instruments.
Microwave Radiometer Measurements of the Cape Cod Canal
In the early days of the AAFE program, Jules Lehman from the NASA Headquarters Office of Applications called and asked me to come to Washington as soon as possible. When I arrived, he described an experiment at the Buzzard’s Bay canal that was run by Doc (Harold I.) Ewen, that was not in operation due to lack of funds on a fixed price contract. He wanted my branch to take over the contract and complete the project. I asked Cal Swift to go up to Cape Cod and review the system and the measurement program. When Cal came home we came up with a program and an adequate budget to complete the intent of the original contract. The results of that work are reported in the references.[1]
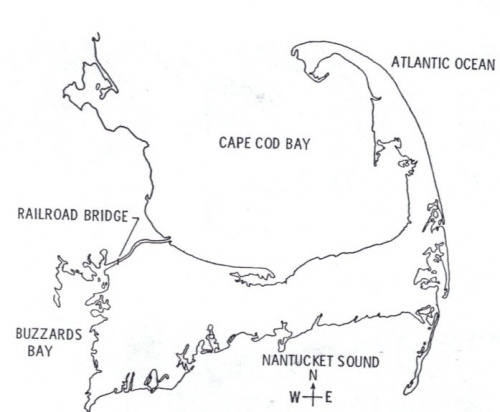
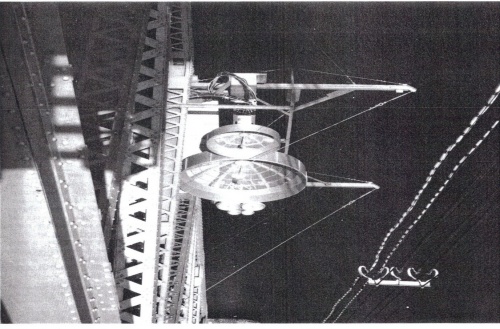
Mounting radiometer systems operating at 7.5, 4.0, 1.4, and 0.75 GHz on the railroad bridge over the Cape Cod Canal comprised the experiment. Pairs of reflectors were used at the higher frequencies in order to separately receive horizontal and vertical polarization. At the lower frequencies the antennas were rotated to obtain the two polarizations. The canal connects Cape Cod Bay and Buzzard’s Bay and is sufficiently deep and wide enough to allow ship traffic. The system is operated by the Army Corps of Engineers. The railroad bridge is indicated in Figure 1. The water flow through the canal is caused by the salt-water tides.
The area around the assembly was instrumented to obtain water temperature, wind speed, and other metrological and sea surface parameters. The radiometric brightness temperature was measured at the various frequencies and polarizations over a period of nine months in order to obtain a comprehensive set of data.
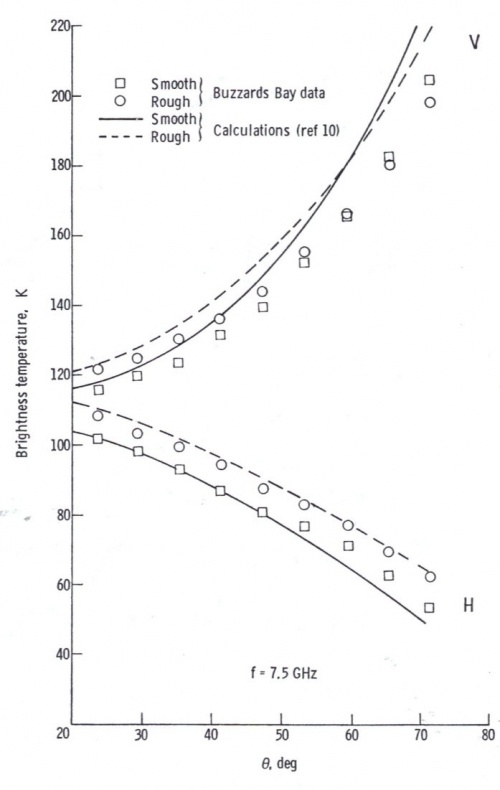
Typical of the computed and measured radiometric data is given in Figure 3.
Wagner,R.J. and P.J. Lynch, ”Analytical Study of Microwave Sea Brightness T, Temperatures , A Composite Surface Model“, Tech. Rept. 17608-6010-RV-00, 1977 (Radio Science, volume 9, July 1974, pp 641-653. Reproduced by permission of the AGU)" class="fck_mw_frame fck_mw_center" />
Radiometer Development on the AAFE Program
The development of microwave radiometers was made on the AAFE Program in the early 1970’s. Dr. Alan Love organized a group at North American and submitted a proposal to develop a S-Band radiometer for the measurement of sea surface temperature. Dr. Love and his staff developed the precision radiometer as documented in the references below.[2][3]
The S-Band radiometer developed by Dr. Love, et.al. was delivered to my branch where a group of my staff led by Dr. Hans Blume worked to integrate the radiometer into a DC-4 aircraft along with a digital data system. After checkout, missions were planned at S-Band to measure water temperature in the lower Chesapeake Bay including several miles out to sea. The Chesapeake Bay has a series of marker buoys that populate the bay to mark the channels to the York River, Hampton Roads to the James River, and the channel up to Baltimore, and other smaller rivers.
The sea truth for the first temperature measurements, were made by Cal Swift and me. In the mission planning session we reviewed the nautical charts and picked a number of buoys that could be reached by a small boat in a few hours. The day of the mission we launched Swift’s boat and then proceeded to the first marker buoy. We had buckets which were used to dip sea water. The thermometers were used to measure temperatures and sea water samples were placed in containers for later analysis. One of the first papers written about the results was Blume's.[4] An L-Band radiometer was designed, built, and calibrated. Algorithms were developed by the same team so that both sea temperature and salinity could be measured. A report on mapping sea temperature and the salinity in the Chesapeake Bay was published in the below reference.[5]
Scatterometers
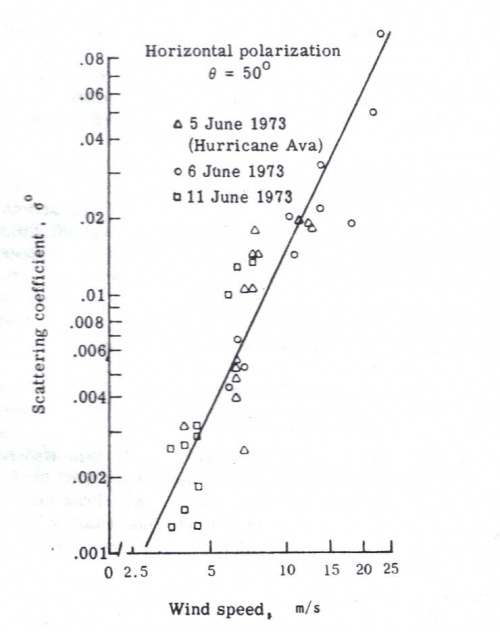
While the entry physics program was completed, there were developments of radar scatterometers to measure ocean wind speed.Some of the first reports were made by Dr. R.K. Moore[6] relative to a series of SKYLAB experiments.The SKYLAB instruments operated at 13.9 GHz and were packaged with a mechanically scanned pencil beam antenna. Aircraft underflights were flown to obtain “ground truth“ information.There were a number of underflights by NASA-JSC and NRL. The data obtained had a large deviation as reported in the references.[7][8][9]
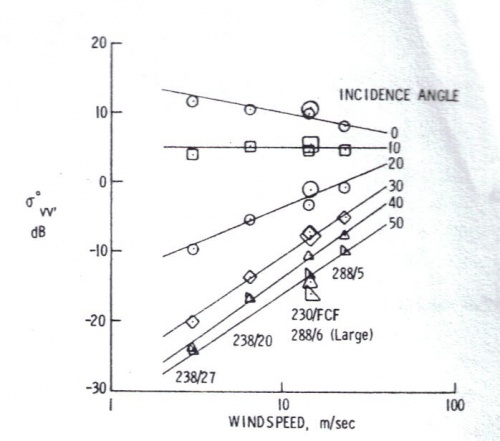
In the early 1970”s a scatteromer was developed on the AAFE program and supervised by Dr. W.L. Jones in my branch at NASA Langley Research Center. Dr. Moore from University of Kansas was the senior adviser on the project. The Langley staff designed much of the scatterometer hardware and used the backup hardware from the Skylab program. The antenna was a dual polarized fed dish that was mounted on the backramp of of the NASA Houston C-130 aircraft.The RADSCAT instrument was flown in underflights of a Skylab mission. Papers documenting the underflights and other RADSCAT missions are documented in the references.[10][11][12]
A typical result of the Skylab measured ocean scattering coefficient at 50 degrees incidence angle is given in Figure 4.
There were a number of under flights by NASA –JSC and NRL. In order to resolve the differences the AAFE RADSCAT, as described previously, was flown and data reported such as that described in Figure 5
Stepped Frequency Microwave Radiometer
A staff member of the NASA Langley EM Branch, R.F. Harrington, developed a new type of microwave radiometer, the SFMR. The basic design was Dick Harrington’s Ph.D. thesis at Old Dominion University, performed under Dr. William Stanley during the 1970’s. A description of the thesis is given in a NASA Langley Report.[13] In this report the SFMR is described in detail as having balanced Dicke switches, null feedback, frequency operation from 4.5 to 7.2 GHz with bandwidths of 10, 40, 250, or 1000 megahertz and integration times from 0.2 to 20 seconds. The antenna used with the SFMR was a dual frequency corrugated horn antenna. The SFMR was mounted in the NASA Wallops aircraft and flow over the Chesapeake Bay and offshore over the Atlantic Ocean where wind and temperature buoys were located that was suitable for calibration. During the same time period calibration flights were made in rainstorms near the calibration buoys. At C Band the atmospheric attenuation is low and the radiometer return at multiple frequencies is proportional to surface wind speed. Hence, by flying the SMFR above the rain storm the instrument can obtain a good estimate of rain rate and surface wind speed.
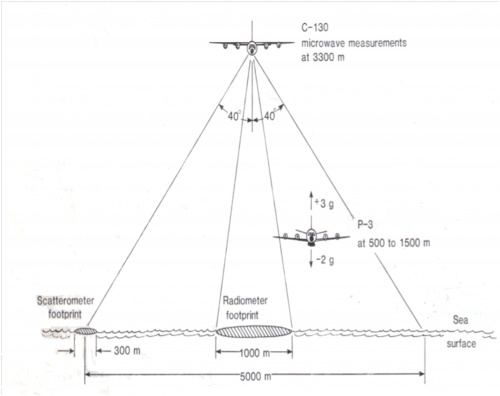
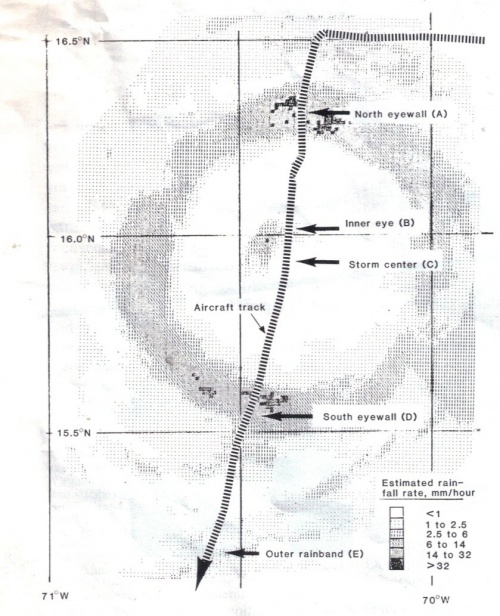
During the 1970’s the Electromagnetic Branch and its staff at NASA Langley established professional relations with a number of other government organizations including NOAA at the Hurricane Center in Miami, Florida. This gave the NASA staff a detailed knowledge of how to install and operate scatterometer and radiometer instruments on various NOAA aircraft that flew through hurricanes. These instruments were installed on a NOAA C-130 aircraft during the summer of 1980. A number of NASA Langley staff were stationed in Miami, and flew to Puerto Rico when Hurricane Allen formed off the African Coast. ”This hurricane was the most intense storm penetrated by aircraft in the North Atlantic region”.[14] There were three aircraft that flew through the storm.
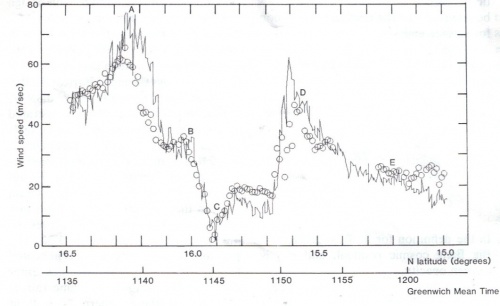
The relative positions of the aircraft flying through the storm are shown in Figure 6. The winds determined by the scatterometer were determined in the regions of no rainfall and extremely light rainfall. The regions of rainfall are given in Figure 7.
" class="fck_mw_frame fck_mw_center" />
" class="fck_mw_frame fck_mw_center" />
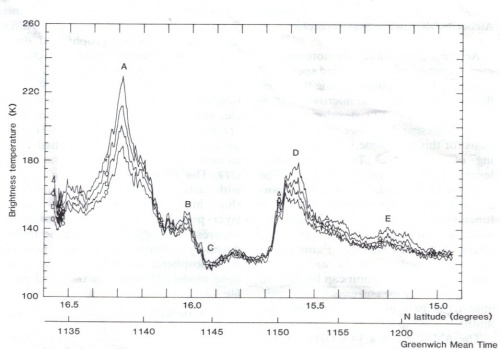
The SFMR proved to be very versatile and was able to determine rain rate and wind speed to a reasonable accuracy.The brightness temperature across the storm is given in Figure 8.
" class="fck_mw_frame fck_mw_center" />
" class="fck_mw_frame fck_mw_center" />
Oil Spills on the Ocean
In the mid 1970’s Congress mandated that NASA determine how space technology could be used to detect and monitor oil spills. I took on that responsibility as part of rhe AAFE program. I contacted the American Peteroleum Institute and found out that they had a permit to spill oil and dispersants in the waters off of New York and New Jersey. API had contracts with J.B.F. Scientific to perform those experiments. Other organizations that had conducted theory and experiments included the Naval Research Laboratory, the Canadian Center for Remote Sensing ( CCRS), Environmental Research Institue of Michigan, DOT, and the USCG, among others.
I visited many of these organizations, and decided to include the USGS, two CCRS aircraft, and a Coast Guard aircraft with various sensors listed below.
List of Sensors Carried By Participating Aircraft
| USCG | NASA-WFC | CCRS | CCRS |
| C-130 (AOSS) | C-54 | DC-3 | CV-580 |
| Passive microwave imager | *AOL (Flourosensor mode) | MK-III laser fluorosensor | UV/IRLS |
| UV/IRLS | *22 & 31 Ghz passive microwave imager | MSS (10 channels visible & thermal IR) | X-L band SAR |
| Nadir looking color 12 cm photo camera | *Television camera | Optical Multichannel analyzer | 13.3 Ghz fan beam scatterometer |
| X-Band SLAR | Sea surface contouring radar | Forward looking low light level TV camera | Nadir looking color 23 cm photographic camera |
| *Nadir looking 70nm & 35 nm color photographic camera | Pushbroom scanner | ||
| Nadir looking color 70 nm photographic camera |
Entries marked with * indicates sensors used in the data reported here.
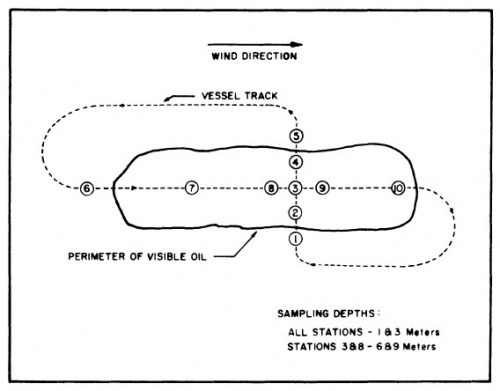
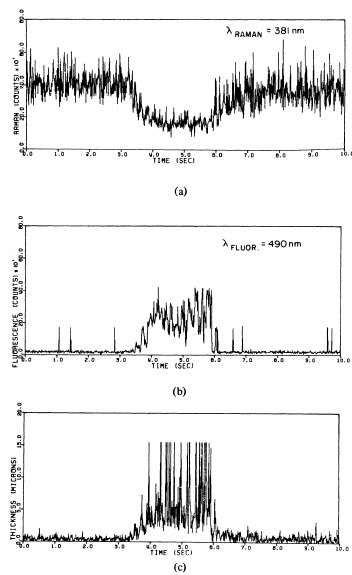
The EPA permit allowed four spills of 440 gallons of LaRosa and Murban each and the spraying of dispersant. These oils have viscosities and other properties representative of the range of crude oils transported on the sea. The first two spills were allowed to spread for 2 hours prior to the application of dispersant from the helicopter. The third and fourth spills were made and the dispersent was applied after 10 minutes of the spill. During each field experiment a small spotter plane directed the ship Annadale and the spray helicopter. The NASA C-54 directed all remote sensing aircraft and the NOAA ship Kelez which deployed navigation and calibration aids for remote sensors. The ship sampling stations are shown in Figure 10.
W.F. Croswell et. al.,” Ocean Experiments and Remotely Sensed Images Images of Chemically Dispersed Oil Spills”, IEEE Tranactions on Geoscience and Remote Sensing, volume GE-21, No. 1, January, 1983, page 4, 6. " class="fck_mw_frame fck_mw_center" />
" class="fck_mw_frame fck_mw_center" />
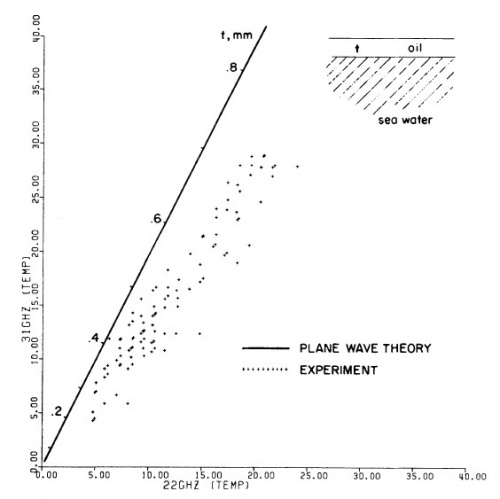
In Figure 11 the oil thickness inferred from the microwave brightness temperature for the 22 and 31 Ghz is compared with the plane wave value computed from measured in situ data. The disagreement is due to the nonuniformity of the oil on the sea.
There are numerous results presented in this paper which demonstrate the nonuniformity of the surface oil and the submersion of the oil below the surface particularly when the dispersants are applied. At the time of this experiment it was not clear that oil spills could be reliably detected from space due to instrument limitations and due to atmospheric absorption at the frequencies the microwave radiometers and AOL operated at.
1981 - present
I retired from NASA Langley in late 1981 and joined Harris Corporation. I retired from Harris Corporation in 2007. My work at Harris was classified and therefore I cannot discuss it. I wrote chapters in the Antenna Engineering Handbook, edited by John Volakis and wrote a chapter on broadband arrays in the Modern Antenna Handbook, edited by Constantine Balanis.
References
- ↑ Swift, C.T.,” Microwave Radiometer Measurements of the Cape Cod Canal”, Radio Science, July,1974
- ↑ G. W. Hidy et.al, ”Development of a Sattelite Microwave Radiometer to Sense the Surface Temperature of the Worlds Oceans”, NASA CR-1960, 1972.
- ↑ G.W. Hidy et. al.,” An S Band Radiometer Design With High Absolute Precision”, IEEE Transactions Microwave Theory and Techniques , vol. MTT -22, pp.852-855, 1977.
- ↑ H-J Blume, et. al. ,” Radiometer Observations of Sea Temperature at 2.65 Ghz Over the Chesapeake Bay, IEEE Transactions on Antennas and Propagation, Vol. AP-25, pp121-128,1977.
- ↑ H-J Blume, et. al. ,” Measurement of Ocean Temperature and Salinity via Microwave Radiometry” Boundary - Layer Meteorology’, vol. 13, pp 295-380.
- ↑ R.K. Moore, et.al. “ Simultaneous Active and Passive Microwave Response of the Earth- The Skylab RADSCAT Experiment” in Proc. 9th Symposium on Remote Sensing of the Environment, Ann Arbor , Michigan, April, 1974.
- ↑ J.C. Daley,” An Empirical Sea Clutter Model”, NRL Memo Report 2668, Dec.1973.
- ↑ G.A. Bradley , “ Remote Sensing of Ocean Winds Using a Radar Scatterometer” , Phd Dissertation ,Univ. of Kansas Center for Research,Inc. , 1971.
- ↑ J.P. Classan and H.S. Fung, “ The Wind Response of Radar Sea Return, Its Implication on Wave Spectral Growth” , Univ. of Kansas Center for Research, Inc., Tech Rpt. 186-5, Sept. 1971.
- ↑ C.T.Swift and W.L.Jones,” Satellite Radar Scatterometers”, presented at the 1974 IEEE Intercon, New York , March, 26-29, 1974.
- ↑ W.L.Jones et. al. , “ Microwave Scatterometer Measurements of Ocean Wind Vectors” , presented at the 1974 USNC/URSI Meeting, Boulder ,Colorado, Oct. 1974.
- ↑ W.L.Jones, et.al. ,” Microwave Scattering From the Ocean Surface”, IEEE Transactions on Microwave Theory and Techniques , December, 1975.
- ↑ R. F. Harrington, NASA Tech Memo 81847, 1980.
- ↑ W.L. Jones ,et.al.,” Airborne Microwave Remote Sensing Measurements of Hurricane Allen “,Science, 16 October, 1981, vol. 214,no. 4518, pages 275-278. (Data reprinted with permission from AAAS.)
